Are Lexington home prices higher downtown or in the suburbs? If you have asked that while scrolling listings, you are not alone. Prices in Fayette County cluster by neighborhood type, and those patterns can help you buy or sell with more confidence. In this guide, you will learn how to read neighborhood price trends, what drives appreciation, and how to use the right data for your next move. Let’s dive in.
What drives price patterns in Lexington
Location and housing stock
Neighborhoods close to downtown and the University of Kentucky tend to show higher price per square foot. Many homes are older with unique architecture, mature tree canopy, and limited lot turnover. Scarcity and walkability support values over time.
Newer subdivisions often have larger floor plans and modern layouts. You may see a premium for new construction compared to nearby resale homes. Outlying and semi-rural parts of Fayette County can offer more land for the money, but per-square-foot pricing will vary with condition and lot size.
Amenities and access
Proximity to parks, retail, hospitals, and job centers matters. Easy access to major corridors like I-75 and I-64 can widen the buyer pool. Neighborhoods with consistent maintenance and convenient services often show steadier long-term pricing.
New construction and planning
When builders add supply in a price band, it can shape resale values nearby. In mixed-use districts and growth corridors, appreciation depends on ongoing commercial activity and infrastructure. You can track projects and zoning activity through the Lexington-Fayette Urban County Government’s planning resources for context on future supply and demand. Explore current initiatives on the LFUCG Planning page.
Investor and campus effects
Areas near the University of Kentucky and downtown rental hubs operate like micro-markets. Investor activity and student demand influence pricing, turnover, and yields. Owner-occupants should account for higher turnover and mixed property conditions, while investors should focus on rent-to-price ratios and occupancy trends.
Citywide trend context
Lexington followed a national pattern in recent years. Prices surged in 2020 and 2021, cooled in parts of 2022 and 2023 as rates rose, then showed localized strength through 2024 depending on neighborhood and inventory. Regional context from the University of Kentucky’s Center for Business and Economic Research can help you frame local shifts within broader economic trends.
Appreciation is never uniform across the county. Areas with constrained supply, walkable amenities, and consistent upkeep tend to retain value better. New-build corridors can appreciate well during growth phases, then moderate as more phases deliver.
How to compare neighborhoods the right way
Core metrics to watch
- Median sale price and median price per square foot
- Distribution by price band, such as 25th, 50th, and 75th percentiles
- Days on market and sale-to-list price ratio
- Inventory and months of supply
- New construction share vs. resale share, plus typical home age and lot size
These indicators come from local MLS data and public records. For parcel-level details like year built and lot size, the Fayette County Property Valuation Administrator is a helpful reference.
Time windows and sample size
Look at both 12-month and 36-month trends to balance recency and stability. In small neighborhoods with fewer than about 12 to 20 sales per year, medians can swing. Use rolling averages and percentiles to reduce noise and avoid overreacting to one or two outliers.
Defining neighborhood boundaries
Neighborhood lines are not always official. To keep comparisons consistent, use LFUCG neighborhood maps, standardized census tracts, or zip codes. If sales counts are thin, combine adjacent areas or use rolling windows to create a clearer picture. You can also reference the U.S. Census American Community Survey for housing stock characteristics at the tract level.
A simple map of Lexington’s price clusters
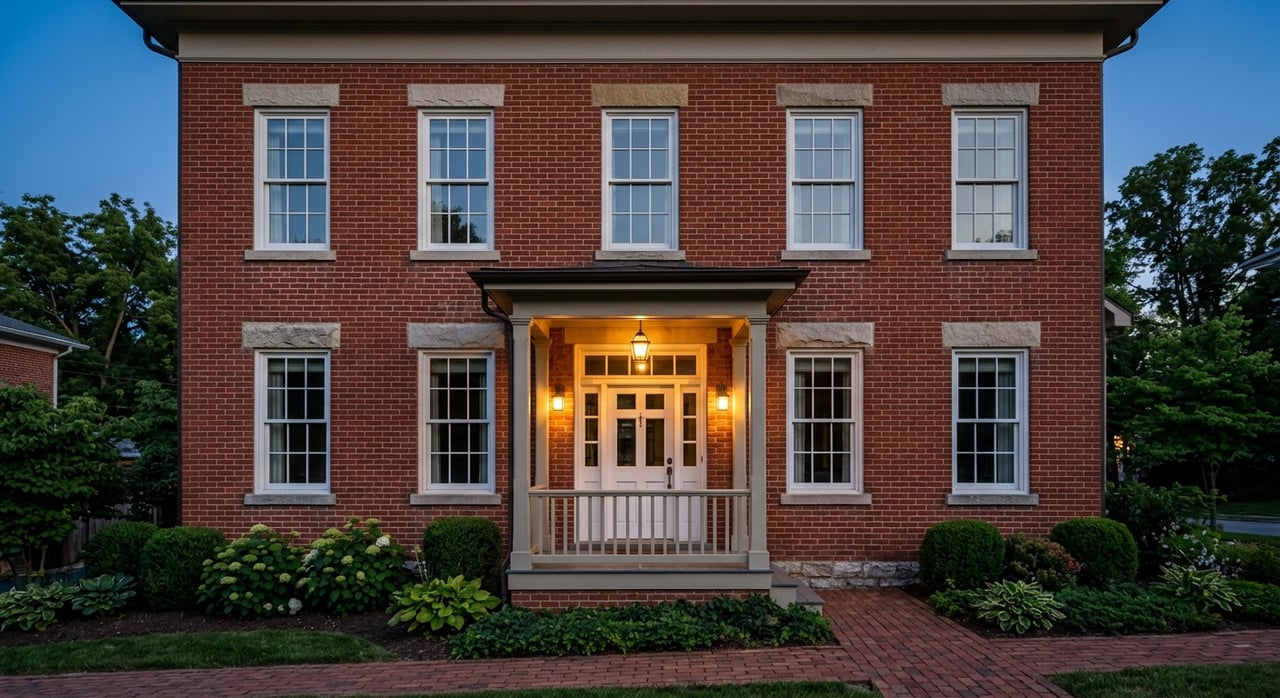
Historic core and near-downtown
These are older neighborhoods with character homes, smaller lots, and close proximity to arts, dining, and UK. You will often see higher price per square foot and steadier long-term appreciation. Expect more competition for updated listings and higher remodeling costs due to age and craftsmanship.
What this means for you:
- Buyers: Plan for smaller but well-located homes. Budget for maintenance and renovation.
- Sellers: Highlight character, walkability, and recent system upgrades in your marketing.
- Investors: Focus on condition and tenant profile. Maintenance reserves matter here.
University-proximate micro-markets
Close to campus, properties often serve student and staff demand. Duplexes and single-family rentals are common, and turnover can be higher. Values track local rents, enrollment, and housing policy.
What this means for you:
- Buyers: Expect mixed upkeep levels and variable noise patterns block by block.
- Sellers: Showcase rent history and low vacancy if you market to investors.
- Investors: Underwrite with conservative rent, vacancy, and capital expense assumptions.
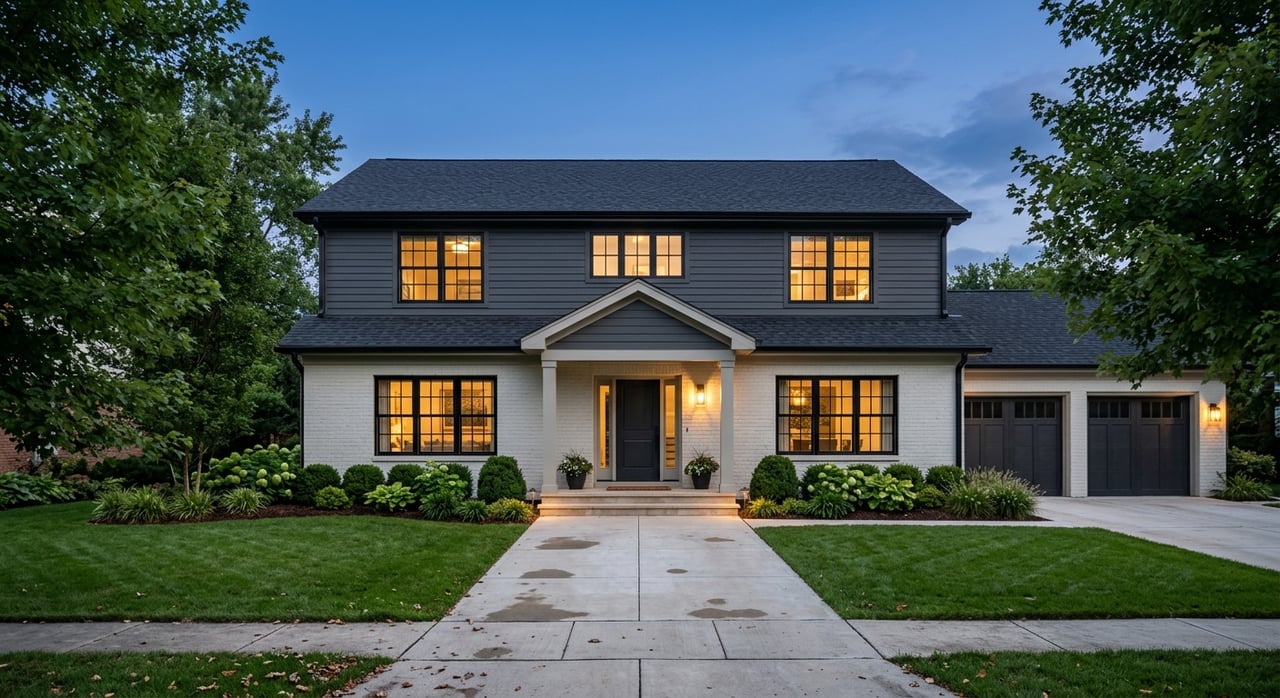
Established suburban neighborhoods
Many postwar through early 2000s subdivisions offer larger homes and yards at mid-price tiers. These areas tend to show steady demand from a wide range of buyers. Values reflect condition, nearby amenities, and replacement costs.
What this means for you:
- Buyers: Compare price per square foot across similar homes to spot value.
- Sellers: Use fresh, nearby comps and watch days on market and sale-to-list ratios.
- Investors: Consider long-term rental stability and simple, durable finishes.
Growth corridors and mixed-use districts
Master-planned areas and commercial nodes can command premiums for new construction and convenience. Appreciation often follows new retail, roads, and services. Supply can expand quickly when builders release new phases.
What this means for you:
- Buyers: Newer warranties and modern layouts are attractive. Compare new builds with nearby resales for value.
- Sellers: If you own in a nearby resale pocket, position upgrades and lot advantages against new-build competition.
- Investors: Watch pipeline inventory. Rent premiums for new homes may compress as more units deliver.
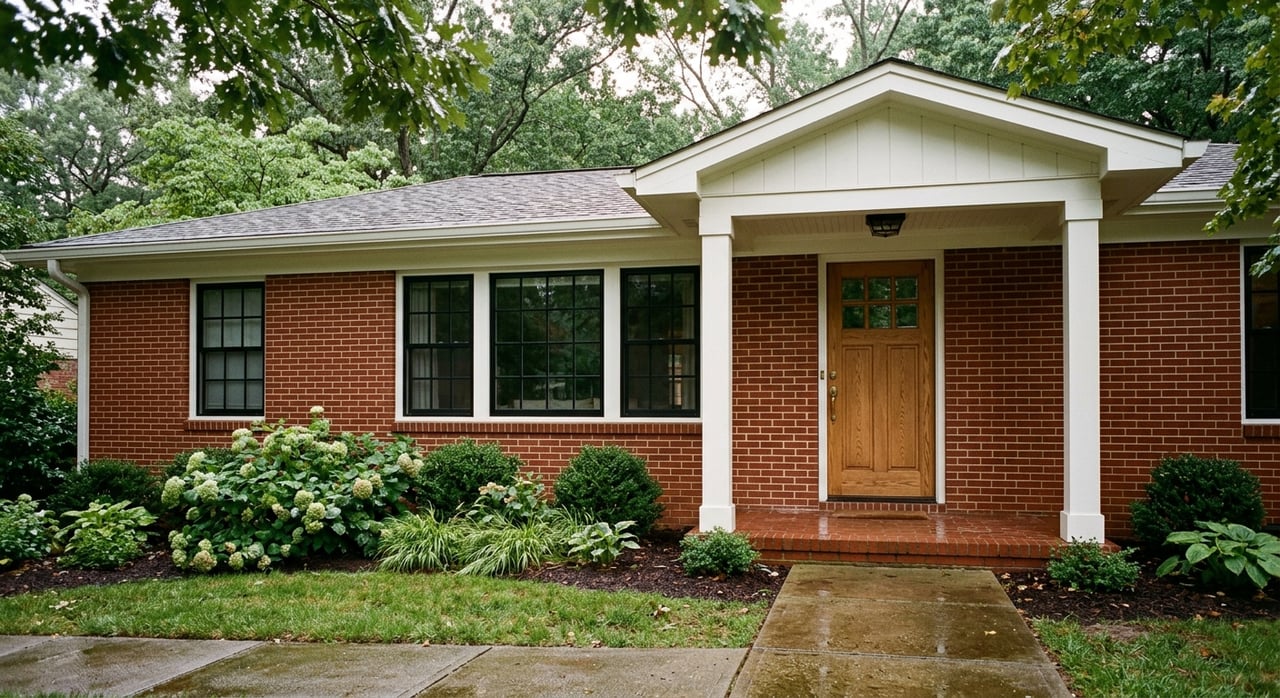
Peripheral and semi-rural Fayette County
Homes on larger lots can be more affordable in absolute dollars, though per-square-foot values vary widely with land and condition. Commute time and public service access are key trade-offs.
What this means for you:
- Buyers: Evaluate road access, utility details, and property upkeep.
- Sellers: Emphasize land attributes, outbuilding potential, and recent improvements.
- Investors: Track planning and zoning changes. Land value can shift quickly near development.
How to read “median price” like a pro
Median price is a middle point. It helps avoid distortion from one very high or low sale. In neighborhoods with few sales, the median can jump in a single month. That is why it helps to pair median sale price with median price per square foot and distribution percentiles. This mix shows both the typical deal and the range of outcomes.
To verify property traits and reduce apples-to-oranges comparisons, use the Fayette County PVA for lot size, year built, and assessed values. For broader methods and statewide context, Kentucky REALTORS and the National Association of REALTORS share useful frameworks for reading market stats.
Practical moves for buyers
- Define your top three trade-offs: location, size, and condition. Decide where you can be flexible.
- Compare price per square foot within the same neighborhood or adjacent ones with similar housing stock.
- Track months of supply and days on market to gauge competition before you write an offer.
- Use a 36-month view to see how a neighborhood held value across different rate cycles.
- When a small area lacks sales, widen to nearby tracts with similar home ages and lot sizes.
Pricing tips for sellers
- Start with the last 90 to 180 days of comparable sales in your immediate area. Adjust for lot, condition, and square footage.
- Watch the sale-to-list ratio and median days on market. They signal negotiation leverage.
- If new construction is nearby, present your upgrades, yard, and location strengths clearly.
- Confirm home details with the PVA and prepare a clean, updated property data sheet for buyers.
- Use professional photography and precise pricing to capture early momentum.
Notes for investors
- Focus on neighborhoods near universities, job centers, and stable retail nodes for demand.
- Calculate a simple yield check: annual rent divided by purchase price. Cross-check with local vacancy norms and capital expense needs.
- Understand local landlord considerations in student areas. Plan for turnover costs and management.
- When pipeline supply is rising, stress test rents and exit values before you buy.
Data sources you can trust
For local transaction trends, MLS data is your primary source. Public and planning resources help you validate assumptions and understand what is coming next.
- Fayette County Property Valuation Administrator for parcel attributes, lot size, and assessments. Visit the Fayette PVA.
- Lexington-Fayette Urban County Government for planning, zoning, and project updates. See the LFUCG Planning resources.
- University of Kentucky Center for Business and Economic Research for regional economic outlooks and housing context. Review recent materials from UK CBER.
- Kentucky REALTORS for statewide market methodology and comparisons. Explore Kentucky REALTORS resources.
- National Association of REALTORS for national frameworks on inventory, median price, and seasonality. See NAR research and guidance.
- U.S. Census American Community Survey for housing stock, tenure, and median rent indicators by census tract. Learn more about ACS data.
Historical medians describe the past. They are not a guarantee of future returns. Use a balanced set of metrics and multiple time windows to avoid chasing short-lived swings.
Next steps and how I can help
You do not need to be a data analyst to make a smart move. You need clear metrics, reliable comps, and a local plan. I combine neighborhood-level MLS analysis with a practical strategy for pricing, offers, and timing.
If you want a neighborhood-by-neighborhood breakdown tailored to your goals, reach out to Thaddeus Blevins for a custom report, on-the-ground insight, and a modern search and marketing experience from first conversation through closing.
FAQs
What does “median price” mean in Lexington?
- It is the middle sale price over a period, which reduces the impact of extreme highs or lows. Pair it with price per square foot and percentiles to see the full picture.
How should I use price per square foot across neighborhoods?
- Compare within the same area and housing type. Lot size, age, and condition can change per-square-foot values, so keep apples with apples.
How have Lexington prices changed since 2020?
- Prices rose rapidly in 2020 and 2021, cooled in parts of 2022 and 2023 as rates climbed, and showed selective strength into 2024 depending on inventory and location.
Where can I find official neighborhood or planning references?
- Start with LFUCG Planning for maps, zoning, and project updates, and use the Fayette PVA for parcel-level details like lot size and year built.
What is “months of supply,” and why does it matter?
- It measures how long current listings would last at the recent sales pace. Lower supply suggests more competition and firmer pricing, while higher supply can give buyers more leverage.